
Large-load tariff tracker update: Virginia’s GS-5 is effective January 1, 2027. $1.5 million per MW in upfront collateral.
For a 500 MW facility, that’s $750 million before you’ve pulled a permit.

For reference, see the large-load-tariff tracker: https://dctarifftracker.netlify.app/
That number belongs on the balance sheet, not in the operating model. Which is how you immediately know that a lot of the pro formas circulating on Northern Virginia are wrong — they’re treating GS-5 as a rate change, not a capital structure change. The equity sizing is different. The lender conversation is different. The development timeline is different.
This is what the LLT wave actually looks like from the inside: not a uniform rate increase, but a structural bifurcation of the US market into places that require you to restructure your deal and places that don’t.
What the tracker shows
23 utilities now have active large-load tariffs. 11 more have pending proceedings. 18 of the 60 utilities we track have nothing — no minimum billing, no term commitment, no collateral requirement. Those 18 include MidAmerican Energy in Iowa, Oncor in ERCOT DFW, CenterPoint in ERCOT Houston, and Austin Energy. The Pacific Northwest public utility districts — Grant, Douglas, Chelan — have active tariff revisions but no punitive minimum billing structures.
That’s the real split. Not LLT vs no-LLT. It’s cost-restructuring vs normal project finance.
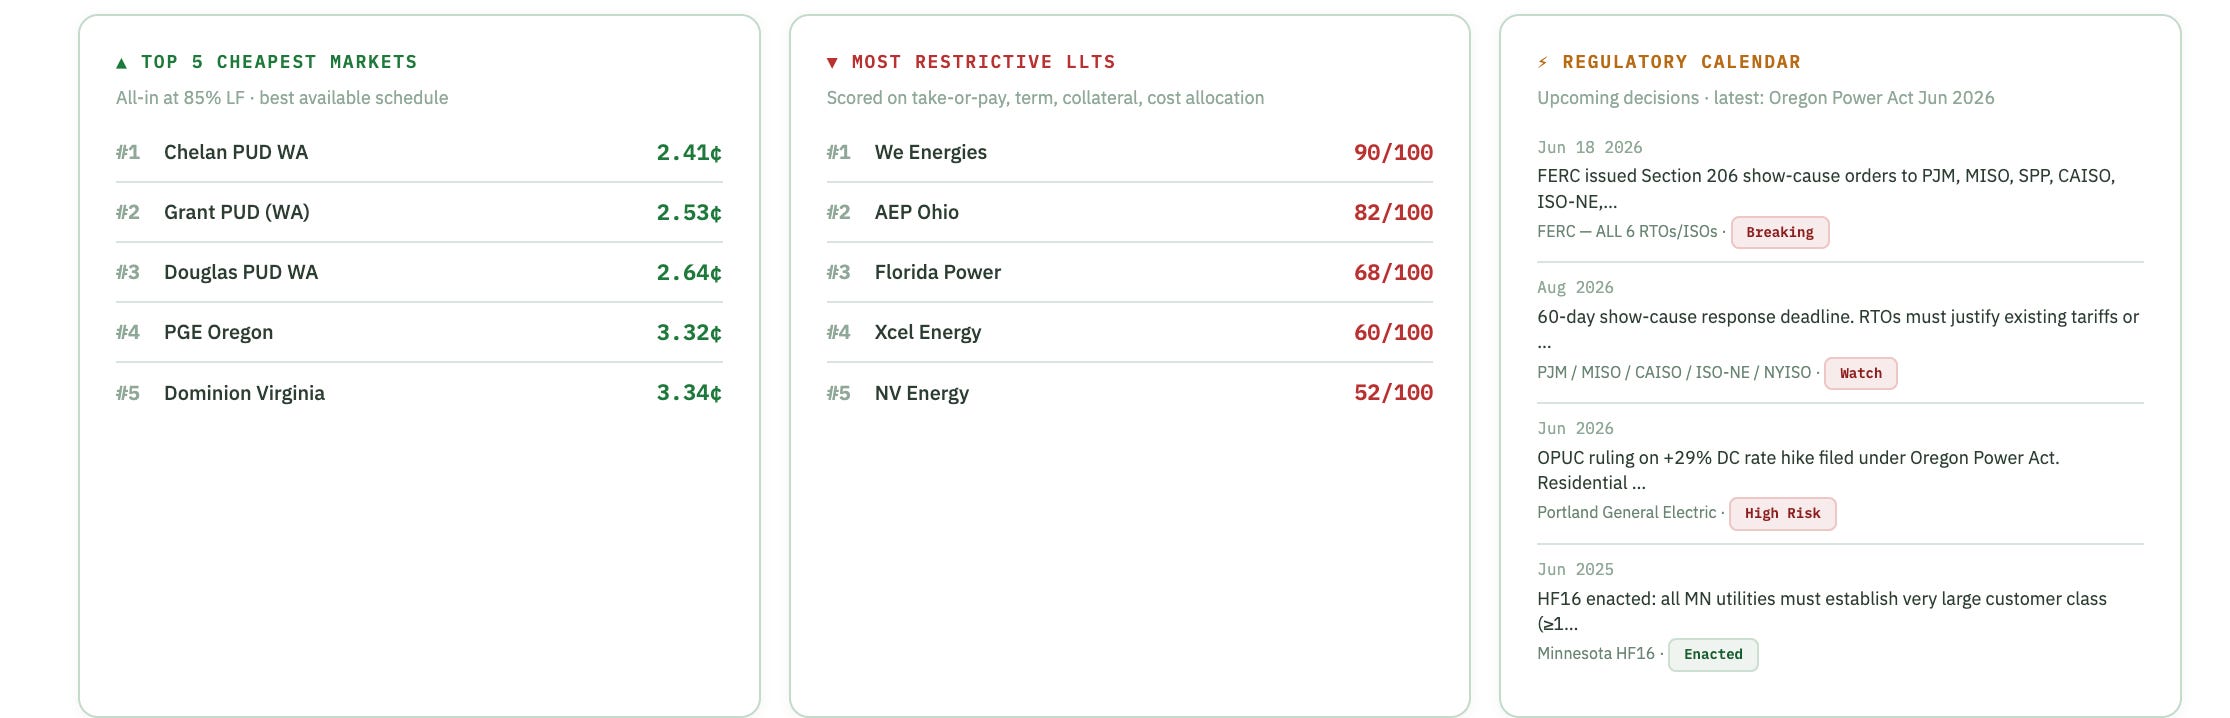
The tracker scores every market on five dimensions: rate, LLT severity, regulatory environment, grid access, and overall. Iowa (MidAmerican) scores 91/100 — top of the A tier. Grant County PUD scores 94, Chelan PUD 93, Douglas PUD 92. These are the markets where a 500 MW deal closes the same way it would have closed in 2022. Everything else has moved.
At the bottom: Xcel Energy at 60/100 (C grade), FPL at 58 (C grade). Those scores are mostly LLT drag. Xcel Colorado filed Schedule TL in April 2026 — 100% new generation and transmission cost allocation, proceeding running through 2026, CPUC approved only 4,100 MW of new generation against the 14,000 MW Xcel requested. That mismatch between the queue and the approved supply is a direct constraint on how many data centers Xcel can actually serve, independent of the tariff terms.
The three structures in play
The active LLTs aren’t one thing. They’re three different risk contracts being called by the same name.
Structure A — minimum billing with collateral. AEP Ohio DCT and Dominion Virginia GS-5. Minimum billing at 85% of contracted demand. Collateral at $1.5 million per MW upfront. AEP Ohio: 12-year term. Virginia: 14 years. The collateral is the differentiating feature. At 500 MW, $750 million sits on the balance sheet from day one. This structure is designed for hyperscalers — Microsoft, Google, Meta — who can fund $750 million off their balance sheet without breaking a sweat. It is not designed for mid-scale developers building on spec or against a lease.
Structure B — 100% cost-to-serve, no collateral. Wisconsin’s We Energies VLC, approved April 24 2026, modified from the original proposal: threshold lowered from 500 MW to 100 MW, 100% resource cost coverage required (the 75% capacity-only option was rejected), 15-year term. Xcel Wisconsin filed a parallel proposal June 22. Oregon’s PGE Power Act framework: 90% minimum billing, 10-year minimum contract scaling to 30 years for loads above 220 MW. At 500 MW in Oregon, you’re committing for 30 years. I’d be curious to see the cap rate model someone runs on a 30-year grid commitment, because that’s not DC development anymore — that’s infrastructure ownership.
Structure C — high load factor threshold, light structure. Kentucky (LG&E/KU): Extremely High Load Factor Service tariff approved February 2026. High utilization requirement to access the tier, but no punitive minimum billing, no $1.5M/MW collateral. Kentucky Power approved similar changes in March 2025. These are the markets where the tariff exists to identify large-load customers as a separate class, not to transfer risk aggressively onto the developer. There’s a meaningful difference between a tariff that classifies you and a tariff that restructures your deal.
Wisconsin is the tell
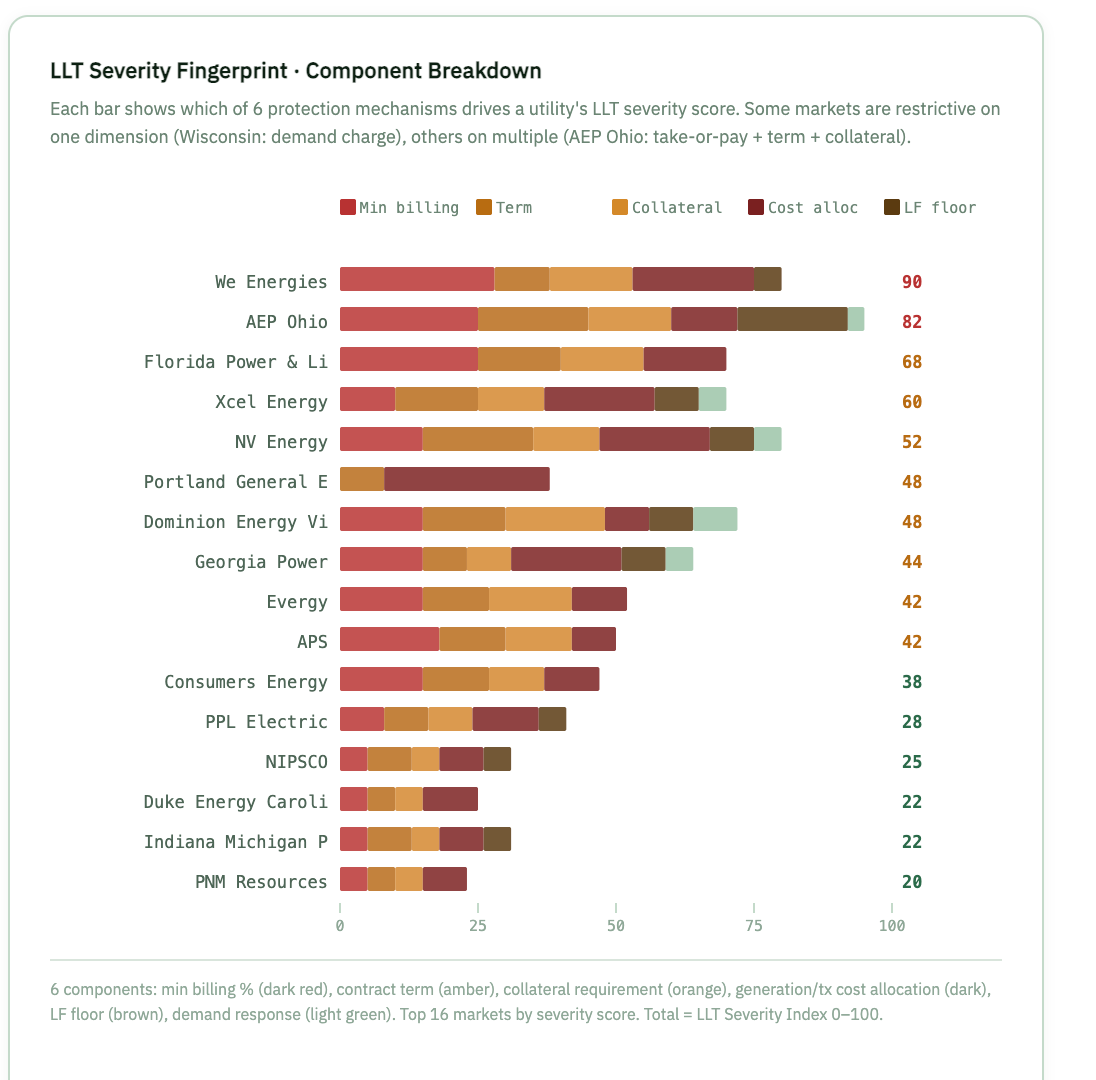
When the PSC rejected the 75% capacity-only option and required 100% cost coverage, it closed the last legitimate route for data centers to partially externalize infrastructure cost onto ratepayers. That’s the precedent that matters from April 24, not the 100 MW threshold reduction (though that matters too — it just catches more projects in the net).
The reasoning in the PSC order is explicit: if We Energies had been denied the VLC tariff entirely, large data centers would still receive utility service, but without conditions specifically designed to safeguard existing customers. The commission chose to impose conditions rather than bar access. That logic — you can build, but you pay your own way — is going to appear in every state proceeding for the next three years.
Xcel following We Energies within 60 days, filing its own 100%-cost-to-serve proposal for Wisconsin on June 22, tells you the utilities have read the same signals. The era of incremental cost allocation negotiation is ending. The template is converging toward 100%.
FERC June 18 changes the federal picture
FERC issued show-cause orders to PJM, MISO, SPP, CAISO, ISO-NE, and NYISO on June 18. Each has 60 days to justify existing tariffs or propose revisions. Five areas: interconnection process, cost transparency, co-location and behind-the-meter generation, flexible transmission services, co-located generation studies.
ERCOT is excluded. That’s not a small detail — ERCOT is where 198 GW of new large-load requests landed in Q1 2026 alone. The federal rulemaking affects every ISO footprint except the fastest-growing one.
The mechanism choice — Section 206 show-cause rather than an NOPR — is worth understanding. An NOPR takes 12-18 months minimum and gets litigated by NARUC on state jurisdiction grounds immediately. Section 206 puts the burden on the ISO: justify your existing tariff or file revisions. NARUC filed comments arguing that FERC asserting jurisdiction over load interconnection would interfere with state authority over retail rate cases. FERC’s answer was to avoid asserting that jurisdiction universally and instead push the ISO to fix their own rules. Legally durable, as they said in April. The 60-day response deadline lands in August.
What this does to the PJM pipeline is the near-term question. PJM’s queue has 300 GW of large-load requests. The show-cause order is going to force transparency on how those requests are processed, which means the speculative requests get harder to maintain. That’s probably good for developers who have real projects — it shrinks the queue around them.
The rate spread has become structural
In 2023, the difference in power cost between the best and worst large-load markets in the US was roughly 3-4¢/kWh. That spread still exists at the rate level. But the total cost spread — including collateral, minimum billing risk, term risk, and exit penalties — has grown to where the markets are essentially not comparable anymore.
Iowa: 3.5-6.5¢/kWh, no minimum billing, no collateral, no term commitment. Oncor ERCOT DFW: 3.5-7.5¢/kWh, same. PGE Oregon: 7.7-12.5¢/kWh, 90% minimum billing, 30-year term at 500 MW.
The energy cost delta between Iowa and Oregon for 500 MW at 85% utilization is around $150-180 million per year at current rates. The term risk delta is the difference between having an exit and not having one for three decades. These aren’t comparable risk profiles being evaluated against a common rate benchmark. They’re different products.
Con Edison in New York is at 9.0-13.0¢/kWh with the NYPSC Case 26-E-0045 proceeding open — the Energize NY Development initiative exploring cost allocation and interconnection reform. National Grid New York at 8.0-12.0¢/kWh. These are markets where the economics have been difficult for a while, and the regulatory direction is toward more allocation to large customers, not less.
Arizona is the interesting pending question. APS forecasts 13.1 GW of peak demand from large customers this year. The AZCC hosted a large-load workshop in April, APS has its XHLF revision pending, and SRP — which sits outside AZCC jurisdiction as a municipal utility — already serves 59 large-load customers at roughly 7,000 MW combined. Arizona has been a model for ratepayer protection through existing tariff structures rather than punitive new ones. If AZCC moves toward a universal large-load tariff, Phoenix gets structurally more expensive. If it doesn’t, SRP keeps winning on economics.
Where I’d put it
Iowa still works. ERCOT still works — though the 198 GW of Q1 2026 requests means the speculative tail is longer than it’s ever been, and the FERC show-cause order to SPP signals that the federal pressure isn’t limited to PJM. The Pacific Northwest PUDs still work on economics, with the caveat that Grant’s April 2026 rate restructure adds 10.6% for large industrial customers and the trajectory is upward.
Northern Virginia: it depends. The GS-5 is manageable for a hyperscaler with $750M in balance sheet capacity. For a developer building against a 15-year colocation lease without a hyperscaler anchor, the collateral requirement plus the SCC’s stated intention to revisit cost allocation in 2027 creates a re-examination risk in year one of a 14-year commitment. I wouldn’t put a speculative data center in Loudoun County today. I’d put a pre-leased, hyperscaler-anchored project there.
The market I’m most cautious about that people are still treating as straightforward is Oregon. A 30-year contract term at 500 MW is not a real estate play. It’s an infrastructure ownership play. The underwriting for those two things is not the same.